Tell us about the job
Takes about a minute. No obligation.
A contractor quoting a water heater installation in Fulton County has to think about what this climate actually puts equipment through, because a spec sheet written for average conditions does not cover it. 218 severe weather events were recorded in Fulton County, Georgia between 2015 and 2024. At that rate, severe weather is a standing operating condition rather than an occasional disruption, and it shapes which equipment a contractor selects, how the unit is positioned, and what the installation has to tolerate over its service life. Sizing for the house is only part of the calculation.
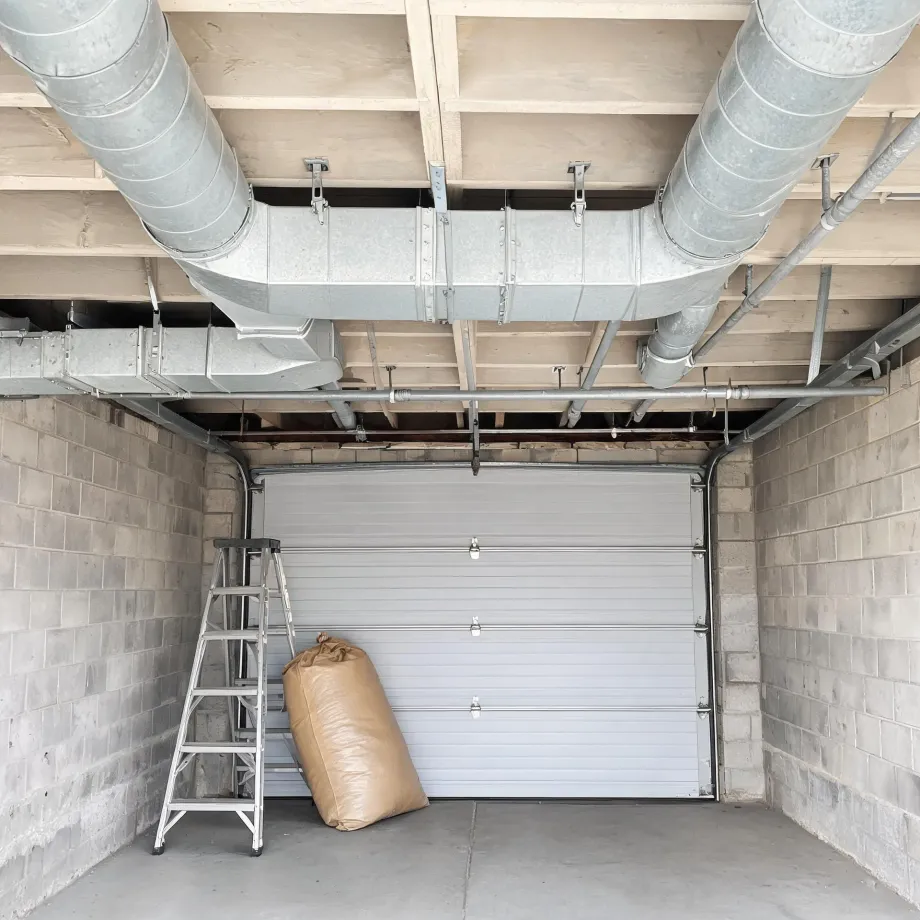
Ductwork routed through a house built around that era was sized and positioned for the systems running then, and what a new water heater needs from those pathways is a different ask. Half the homes in Fulton County, Georgia were built in 1993 or earlier (2020-2024 ACS 5-year). That gap between what the house was built around and what a contractor is installing now is where the job gets complicated or stays simple. An electrician confirming the service capacity and a plumber verifying the existing lines are not preliminary steps; they are the work that determines what the installation actually costs.
What a Water Heater Installation Covers
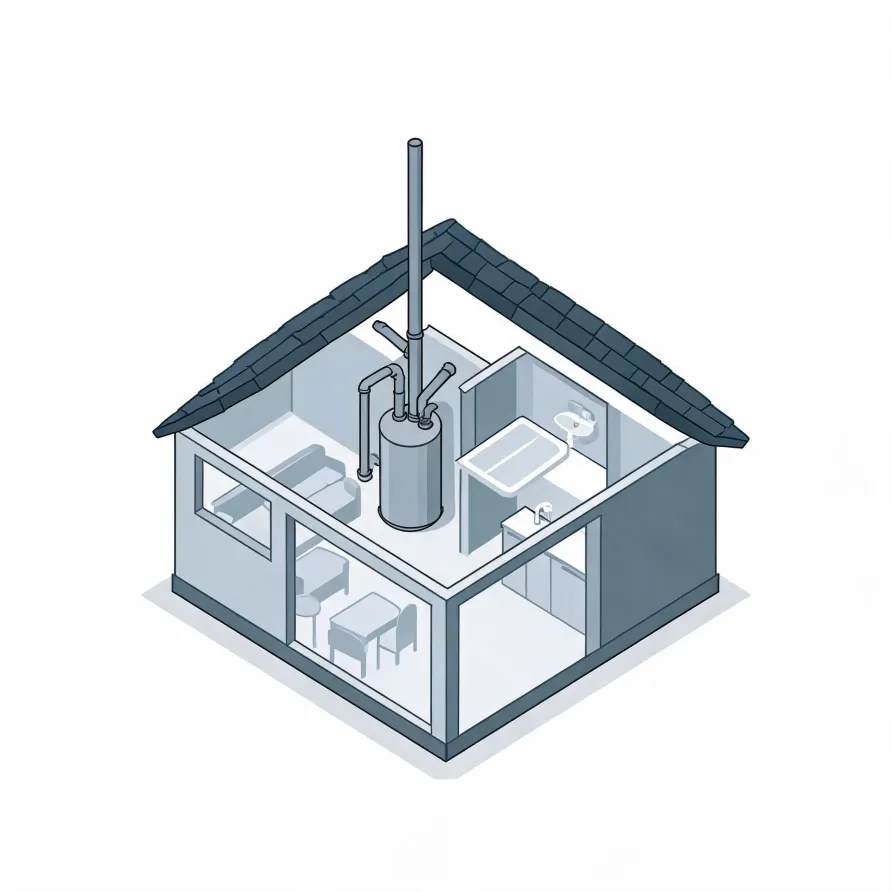
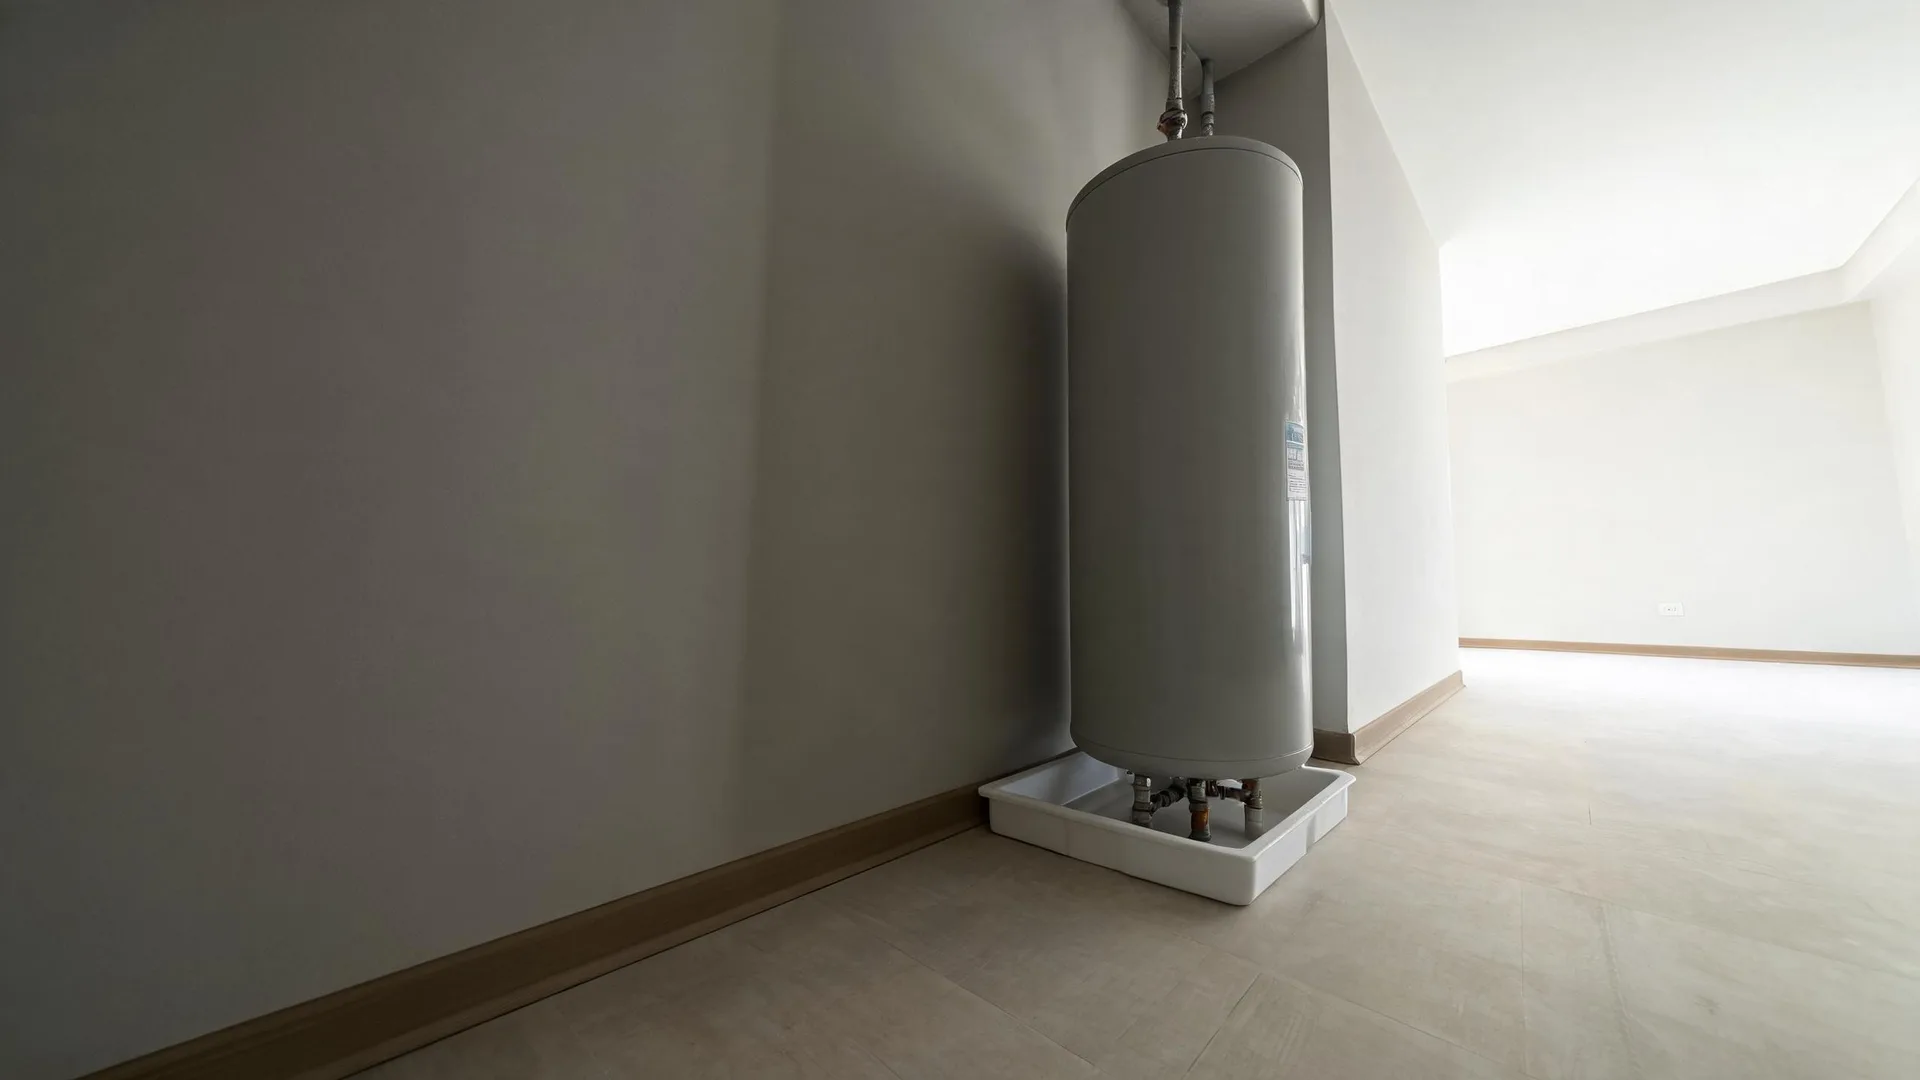
The tank or tankless unit is the heart of the system, sitting in a utility closet, basement, or garage, and its job is to hold or produce hot water on demand. The pressure relief valve mounts directly on the unit and releases pressure if it climbs beyond a safe level.
The cold supply line feeds water into the unit while the hot outlet line carries heated water out to every fixture in the house. A drain pan sits beneath the unit to catch any discharge, and the flue or venting pipe runs from the unit to an exterior wall or roof to exhaust combustion gases safely outside.
The drawing shows a typical layout, and a licensed contractor determines exactly what applies to your home and its existing setup.
Get matched in Fulton CountyFulton County, by the numbers
218 severe weather events were recorded in Fulton County, Georgia between 2015 and 2024.
NOAA National Centers for Environmental Information, Storm Events Database, bulk CSV export, events 2015-01-01 through 2024-12-31.Half the homes in Fulton County, Georgia were built in 1993 or earlier (2020-2024 ACS 5-year).
U.S. Census Bureau, 2020-2024 American Community Survey 5-Year EstimatesFulton County, Georgia holds 507,119 housing units (2020-2024 ACS 5-year).
U.S. Census Bureau, 2020-2024 American Community Survey 5-Year EstimatesOwners occupy 54.3% of the occupied homes in Fulton County, Georgia (2020-2024 ACS 5-year).
U.S. Census Bureau, 2020-2024 American Community Survey 5-Year EstimatesSevere Weather Events in Fulton County
Fulton County's weather puts real demand on water heaters, which work harder and wear faster when conditions swing hard. How much stress that adds is a local fact, and it shapes what a contractor here needs to account for when sizing and installing equipment.
218 severe weather events, 2015–2024. Source: NOAA National Centers for Environmental Information, Storm Events Database.